Unemployment in Switzerland (1990 - present)
Diagram 1990 to present
Diagram 1936 - 2007
Remark concerning the statistical data
Further links
- Economy was never that low as in surrounding countries, because the war did not destroy the economy.
- People for low-salary jobs mostly were from other countries and were sent back if not needed any more.
When for the first time things changed from an unemployment-rate of about 0.1% to about 1% at the end of the 1980ies Swiss officials had no idea how to cope with this situation. The unemployment insurance had accumulated some money, but it could be foreseen that this will be used up soon (also with this low rate). As a first measure both employees and employers had to pay 0.3% into this insurance (before 1991 it was 0.1% of ones salary!). Later this rate was increased to 3%.
I am not the person to report many details here, but the effects for the unemployed people were quite bad (at least until 1995, when the officials thought the nightmare was over):
- The support for unemployed people was lacking totally. Responsibilities were unclear for about 3 years.
- For the first money after loosing the job one had to wait 3 - 4 months. The situation calmed down only about 1994.
- The restrictions to get the money from the insurance were very harsh. They required you to accept jobs with a salary that low as 70% of your last one (and if you lost that again, 70% of that ...).
- Especially for technicians with age over 50 it became very difficult to get a new job:
- In technical areas the experience has not the same value as in social professions.
Due to the half decay time of knowledge a 35 year old may well have the same knowledge as a 55 year old. - The Swiss Pension Fond BVG (Betriebs-Vorsorge Gesetz) uses a rate for the retirement credits
which grows with age: 25–34: 7%, 35–44:
10%, 45–54:
15% and 55–65: 18%. Hence for older people about 1/5 of
the salary depends on the age – which is quite a discrimination.
However, it was not earlier than July 2013 that a politician accepted this at least as a factor Neben dem hohen Lohn können für Firmen auch die mit dem Alter stark ansteigenden Pensionskassenbeiträge ein Grund sein, einem älteren Kandidaten einen jüngeren vorzuziehen FDP Präsident Philipp Müller hat vor Wochenfrist gefordert, dass die Beiträge an die Pensionskassen künftig für alle Arbeitnehmer gleich hoch sein sollen. for the long lasting unemployment of people older than 50 [Neue Luzerner Zeitung, 2013-07-18].
- In technical areas the experience has not the same value as in social professions.
2018-07-10 the association ![]() WorkFair 50+ was founded. They launch a peoples initiative (Volksinititative) to change the rules to «The same approach applies to the calculation of retirement credits for all insured persons regardless of age. Employed persons are liable for contributions from 1 January after the age of 17.». If this will become true the main problem will be to find a good transition …
WorkFair 50+ was founded. They launch a peoples initiative (Volksinititative) to change the rules to «The same approach applies to the calculation of retirement credits for all insured persons regardless of age. Employed persons are liable for contributions from 1 January after the age of 17.». If this will become true the main problem will be to find a good transition …
2018-10-05: The data on which the diagram is based has been in doubt for years. Only those unemployed who have registered with one of the Regional Employment Placement Centres (REAV) are counted. In 2017, 3279 people willing to work (1726 Swiss, 1553 foreigners) fell through this grid: they are out of control and can no longer receive unemployment benefits. On average over the last few years, between 230'000 and 250'000 people willing to work were no longer employed. That is 5.3% of the approximately 4.5 million full-time jobs. The figures collected according to the ILO standard in the surrounding countries are therefore in principle higher than these "glossed over" figures [Luzerner Zeitung 2018-10-01].
![[To top/bottom of page]](../z_designs/nav-dnup.gif) Diagram of unemployment in Switzerland
Diagram of unemployment in Switzerland
Drawn with my script suite FMgraph.
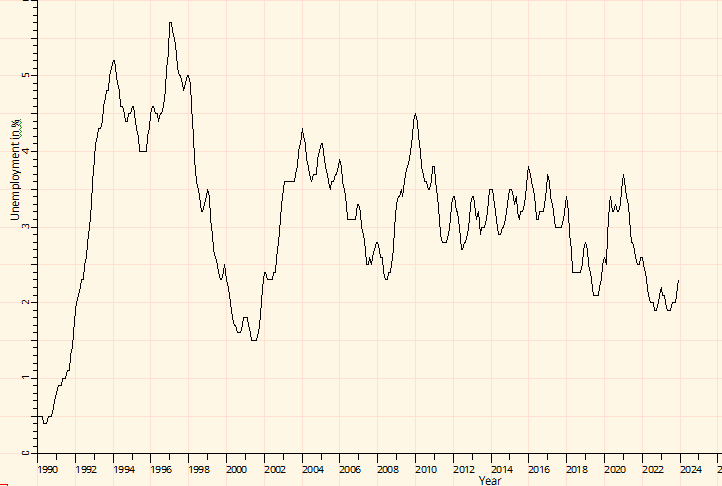
Data source: Unfortunately such a diagram is not available
from 'official Swiss' sources. Only the data tables can be found at the ![]() SECO
(1994 and younger) and at
SECO
(1994 and younger) and at ![]() www.amstat.ch. However, there is a comparable diagram at tradingeconomics.com. You get about the same picture with setting MAX:
www.amstat.ch. However, there is a comparable diagram at tradingeconomics.com. You get about the same picture with setting MAX:
Unemployment Switzerland (1936 to 2007)
The vertical scale is the same as in the diagram above. The horizontal scale is broken at 1970 (no data available) which changes the sequence of labels.
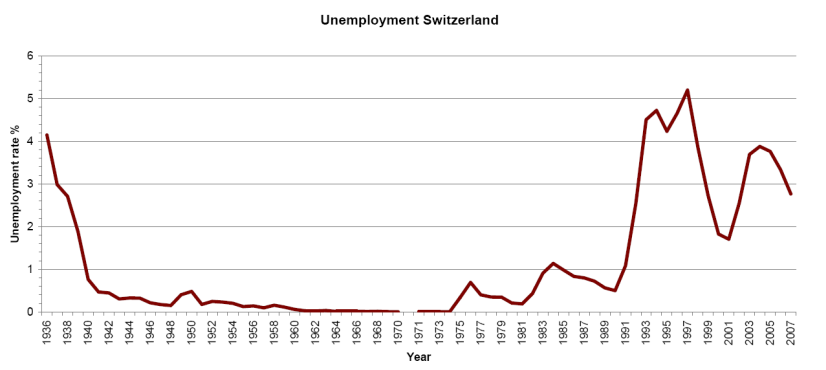
Data Source: Excel file from the Swiss Buro of Statistics.
Remark on the statistical data
As a ![]() comment in the street-magazine Surprise points out, the data do not reflect the real situation of unemployed people. Counted are only those people who are registered at a RAV (Regionalen Arbeitsvermittlungszentren = regional centre for mediating an employment). Not included in the figures are these people:
comment in the street-magazine Surprise points out, the data do not reflect the real situation of unemployed people. Counted are only those people who are registered at a RAV (Regionalen Arbeitsvermittlungszentren = regional centre for mediating an employment). Not included in the figures are these people:
- One has lost his right to receive money from the unemployment insurance (currently this is after 15 months of unemployment),
- One has no employment due to the fact of receiving money from the disability insurance,
- One get only part of the pension form the disability insurance, but can not deploy his remaining ability to work.
Hence the statistical data reflect only those people who are "not working and are searching employment". Looking at the figures of march 2015 reveals: 204'266 people were searching employment and 145108 people where out of work. Thus 59'158 people are not reflected in the statistics – a mere 30 percent!
Further links
 Arbeitsmarktstatistik (aktueller
monat) und archiv
ab 2004
Arbeitsmarktstatistik (aktueller
monat) und archiv
ab 2004 - Regional Unemployment Disparities in Switzerland (1996) : An Explanation
- Verein „Workfair 50+“